
Get a HAR File for Analysis
Diagnosing issues for customers using SSO can be difficult because Interfolio is not able to emulate that portion of the process. When proxying in as the user, Interfolio is bypassing the SSO authentication. When diagnosing an SSO issue, it can help to view what the user sees. HAR (HTTP Archives) allow Interfolio to analyze what users experience in their browser without being there.
Before sending the HAR file to Interfolio, ensure that any sensitive information is removed or obfuscated (such as passwords and client secrets) using a text editor.
Generate a HAR File for Analysis
Chrome
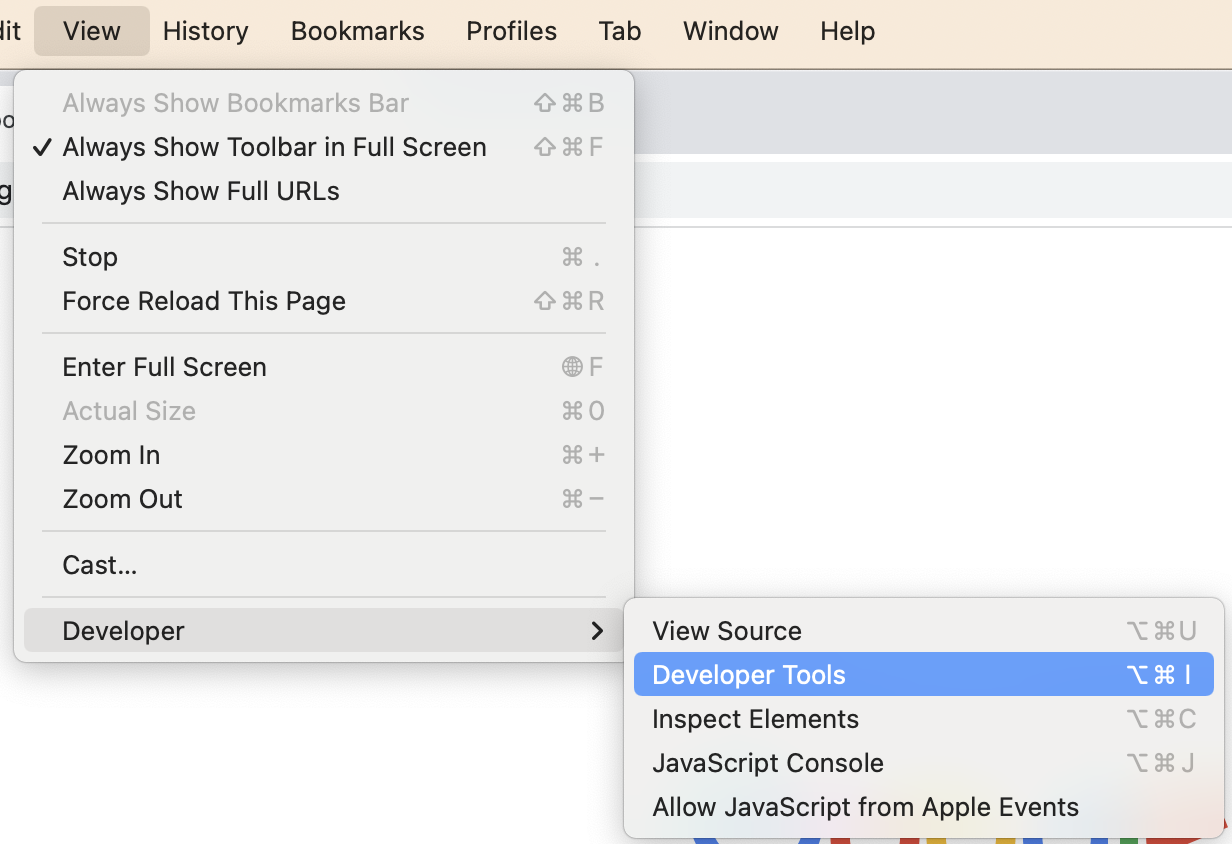
1. Navigate to Developer Tools in Chrome
- Open Chrome.
- Navigate to the Developer Tools by selecting View > Developer > Developer Tools from the toolbar.
2. Ensure the red button and Preserve Log box are checked
- Ensure the Network tab is selected at the top of the drawer that displays.
- Make sure the dot on the left-hand side of the Network tab is highlighted red (click to activate it if it is not).
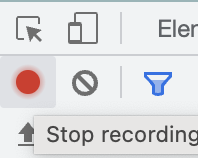
- Click the checkbox adjacent to Preserve log.

3. Send Exported HAR file
- Reproduce the issue from start to finish, including authenticating via SSO.
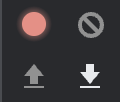
- Click the Export HAR (down arrow) button.
- Send the HAR file that is downloaded to Interfolio for analysis.
Firefox
1. Navigate to Network Monitor in Firefox
- Open Firefox and navigate to the page where the issue is occurring.
- Open the Network Monitor.
2. Save All as HAR
- Reproduce the Issue while the network requests are recorded.
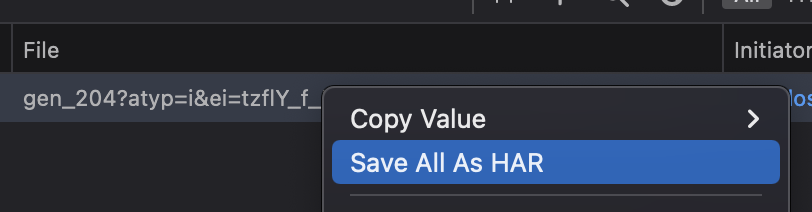
- Right click anywhere under the File column.
- Click Save All As HAR.
- Save the HAR File somewhere convenient.
3. Copy and upload the HAR and log files to support ticket
- Select the Console tab.
- Right click the console box and click Select All.
- Copy and paste the log messages to the preferred text editor.
- Upload the HAR and log files to the support ticket.
Safari
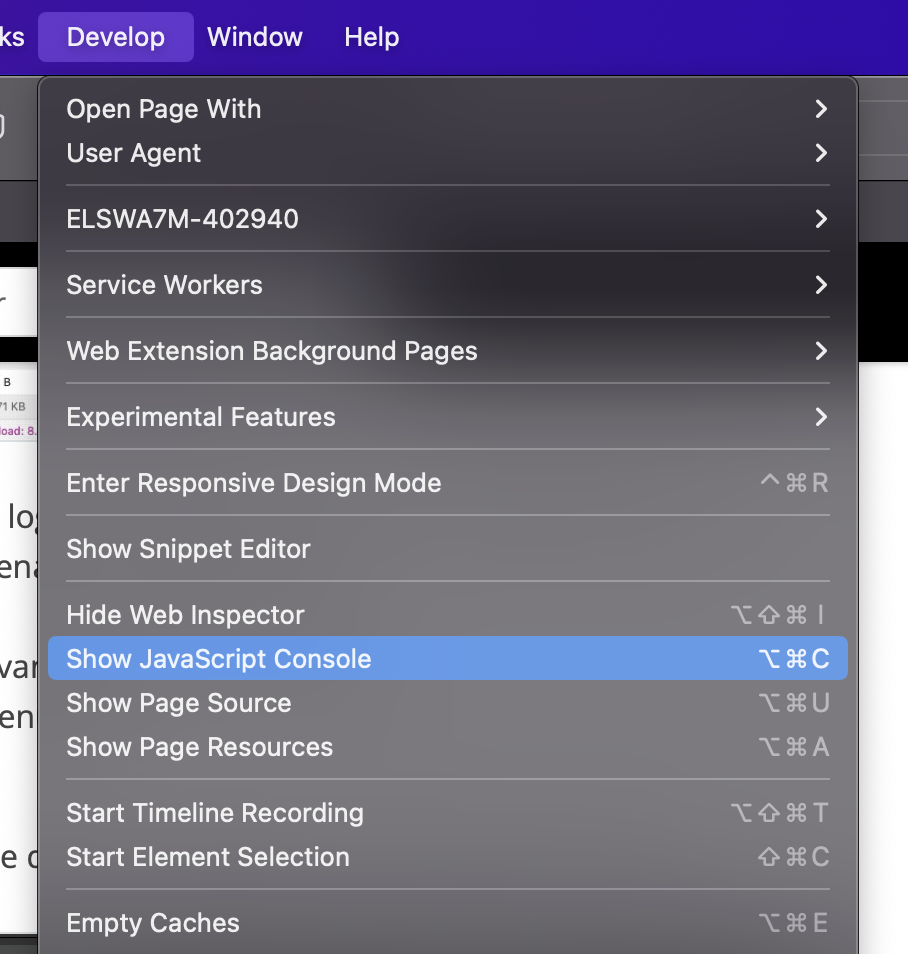
1. Navigate to Show JavaScript Console on the Develop menu
- Open Safari and navigate to the Develop menu.
If you don't see the Develop menu, follow the instructions in the Safari User Guide on How to Use the Developer Tools in the Develop Menu in Safari on Mac for further guidance.
- Select Show JavaScript Console (Mac) or Show Web Inspector (PC).
2. Reproduce the issue on the Network tab
- Click the Network tab.
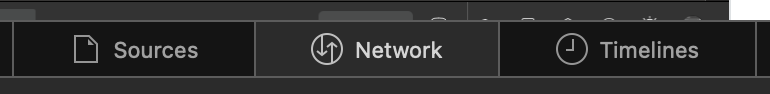
- Reproduce the issue while the network requests are recorded.
3. Save and export
- Click the Export icon.

- Click Save to save the HAR file.
For any issues generating a HAR file in Safari, check out this Safari Developer article for more information.
Internet Explorer
1. Navigate to the Network tab under Developer Tools
- Open Internet Explorer browser.
- Press F12 Developer Tools.
- Select the Network tab.
2. Save recording
- Select the green arrow to start profiling (recording) the session.
- Select the red box to stop profiling the session.
- Select the Save icon the export the recorded session to a HAR file.
Retrieve Console Logs
Chrome
- Open the Chrome browser.
- Navigate to View > Developer > Developer Tools.
- Select the Console tab at the top of the window that appears.
- Screenshot any errors that appear.
To retrieve all console logs, select the Network tab and the click the Export HAR down arrow below the record dot.
Firefox
- Open Firefox and navigate to the Tools dropdown.
- Select Browser Tools > Web Developer Tools.
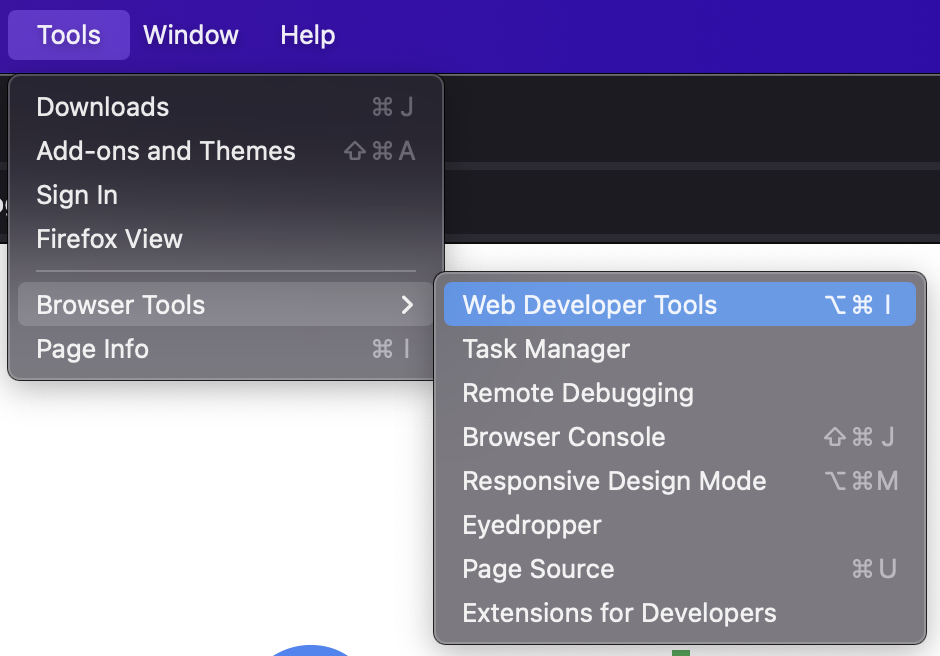
- Select the Console tab from the window that appears.
For PC users, console logs will appear in a separate window.
- Screenshot any errors that appear.
Safari
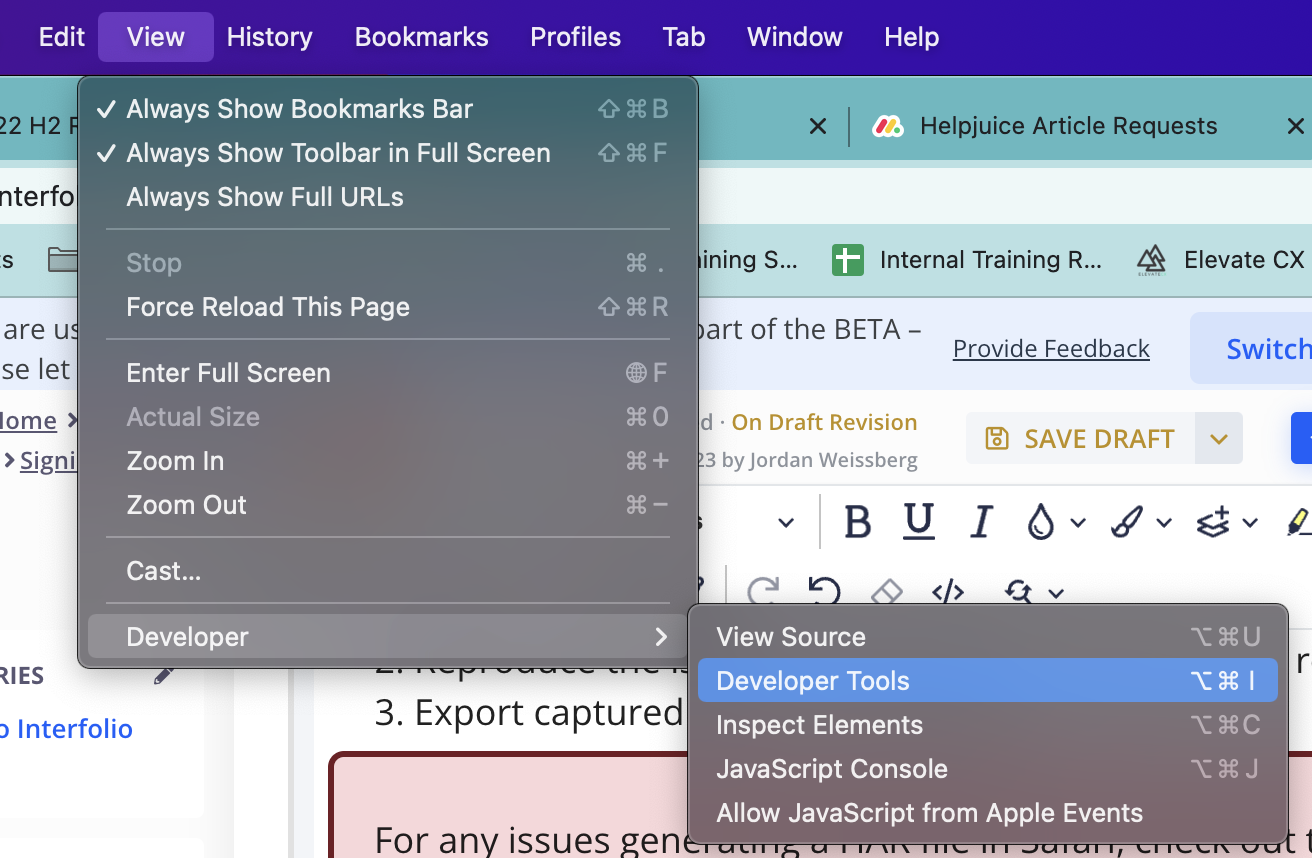
- Open Safari and navigate to the Developer menu.
If you don't see the Develop menu, follow the instructions in the Safari User Guide on How to Use the Developer Tools in the Develop Menu in Safari on Mac for further guidance.
- Select Show JavaScript Console (Mac) or Show Error Console (PC).
- Screenshot any errors that appear.