

Create an Activity Input Report
The Activity Input Report summarizes data from sections like Teaching, Advising Load, Professional Development, Institutional Committees, Grants, and more. It answers questions such as:
- Total entries for Student Supervision by a faculty member for Spring 2015 to Spring 2016.
- Total Advising Load and its breakdown by level for each term from Spring 2014 to Spring 2016.
- Enrollment count for the College of Business for Fall 2011 through Spring 2012.
Report access depends on user permissions. For example, a provost might have access to all university-level reports and below, while deans might only have access to reports for their colleges.
Access the Report
- Navigate to the Reports page under Administration and click Activity Input Report under the Activity Reports section.

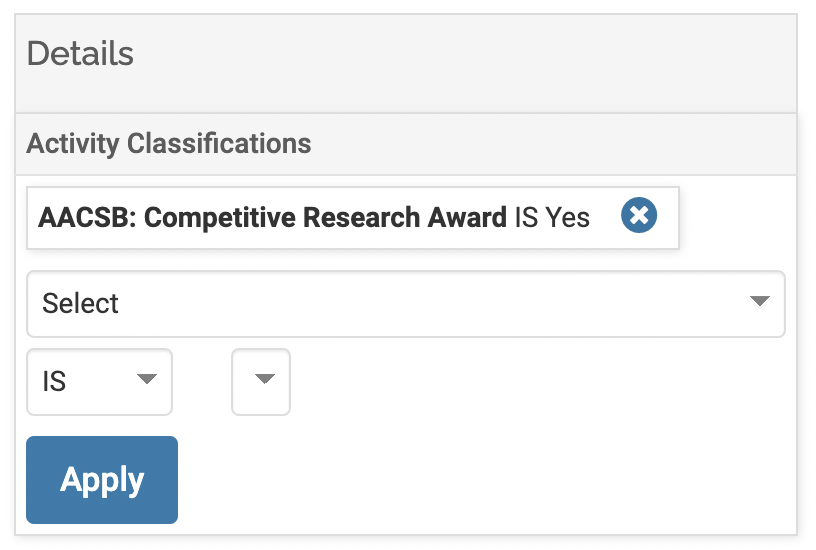
- On the Activity Input Report page select the Unit, Activity Input Form/Section, Measure of Teaching, academic term Begin/end Date, Display Mode, Faculty, and Activity Classification.

- Click the Delete ("X") icon next to the filter to clear an Activity Classification.
Notes
- Activity: Selecting Summary will include all sections of the Activity Input Form
- Measure of Teaching: Selecting Enrollment will indicate that the number shown is related to enrollment.
- Click the Delete ("X") icon next to the filter to clear an Activity Classification.
- Click Apply when finished then Build/Refresh Report.
- You can create a Quicklink to this report for easy access.

FAQ
Why are some activities being shown more than once on the report?
Row totals may include duplicate counts if an activity's status changes across academic terms. To avoid double counting, select only one status level: In Progress, Submitted, Accepted, or Completed/Published.